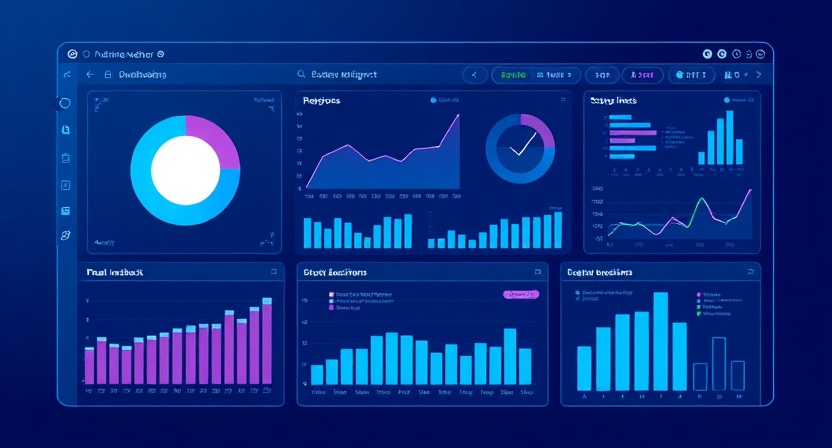
Data alone is meaningless without clarity. Data visualization transforms complex datasets into intuitive charts, graphs, and dashboards, enabling stakeholders to quickly interpret information and make informed decisions.
Clarity and Simplicity
Visualizations highlight trends, correlations, and outliers that spreadsheets often hide. Clear, interactive visuals reduce misinterpretation and accelerate analysis, helping leaders focus on strategy rather than manual data parsing.
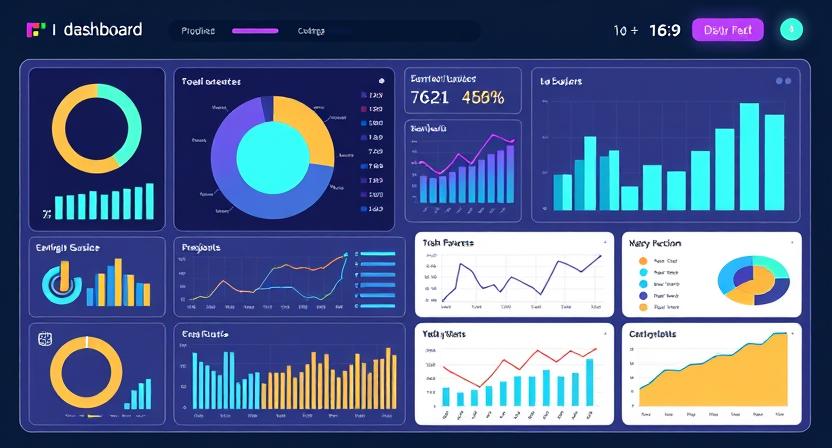
Improving Communication Across Teams
Data visualization bridges the gap between technical and non-technical stakeholders. Interactive dashboards foster collaboration, allowing everyone to access insights tailored to their needs.
Driving Actionable Insights
Visualization ensures that insights translate into action. Teams can monitor KPIs, identify bottlenecks, and implement improvements faster. This enhances agility and operational efficiency across the enterprise.
Integration with Advanced Analytics
When paired with predictive analytics and BI tools, data visualization not only shows historical performance but also projects future trends. Enterprises gain foresight to proactively manage resources, customer experience, and strategic planning.
Investing in effective visualization empowers organizations to transform raw data into actionable intelligence, ensuring clarity, alignment, and competitive advantage.